Back to: Biology 112 Syllabus
Back to: Biology 112: Evolution and EcologyHome Page
Back to: Kenyon College Biology Department
Our mission: to examine all biotic communtiy interactions and their interactions with the abiotic environment. Ecosystem ecology entails the study of energy and nutrient flow through ecosystems.
How can we approach the study of ecosystems:
- energy analysis
- nutrient cycling
- models
A. Energy
Solar energy powers ecosystems (save perhaps for deep sea vents) and drives energy flow through the different
trophic levels. Not that this is a one-way flow through a system (i.e., is not recycled).
Historical background: Lindeman 1942 "The trophic dynamic aspect of ecology". An analysis of the food
web of an ecosystem based on energy flow. He also calculated the efficiency of energy transfer between levels.
The energy pyramid:- solar energy captured in the photosynthetic process. This is not an efficient process - only
about 5% or less of the total sun energy is captured (this varies with the organism's efficiency,
light levels, etc). The remaining energy is radiated back as heat, or used in the process of evaporating water.
The energy that is captured
is the metabolic energy for the ecosystem.
- GPP = gross primary productivity, the total amount of energy fixed in photosynthesis
- NPP = net primary productivity , GPP minus respiration.
- Respiration - energy must be used to maintain oneself. Plants use between 15 and 70 percent of their GPP in their
own metabolism. What is left is NPP. This in turn, fuels the "trophic pyramid"
Where is NPP high? - for example, rainforests (see below), wetlands, coral reefs
Where is NPP low? - for example, oceans (exept in areas of upwelling), open oceans are often described as 'biological deserts'. For instance, more than 50% of the marine fish production occurs in about 0.1% of the total ocean area.
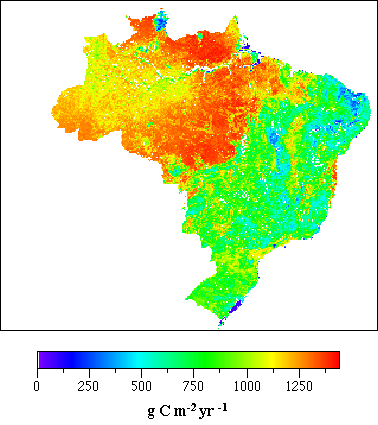
An example from NASA's Global Ecosystem Science Program study on productivity in the Amazon is shown below (thanks
to http://geo.arc.nasa.gov). This study was an investigation of a key ecological question, namely what sets the
limit to productivity...
The degree to which primary production, soil carbon, and trace gas fluxes in tropical forests of the Amazon are limited bymoisture availability and other environmental factors has been examined using an ecosystem model (see below!) for the country of Brazil. A regional geographic information system (GIS) was used to store data on climatic conditions, land cover, and soil properties for input to the NASA-CASA model with an 8-km grid resolution. Results show the spatial differences in productivity across the county in response to these environmental factors. See also the monthly pattern of NPP through this link.

An organizing question for your thoughts on trophic dynamics might be: Why are big, fierce animals rare?
(with thanks to Professor Paul Colinvaux).
-The higher the trophic level the more steps the energy must have traveled through to reach it. In general only
about 10% of the energy available at one trophic level is passed on to the next. The maximum number of links in
an ecosystem is limited by: a) the efficiency of energy transfer between trophic levels and b) the amount of biomass
(energy) that is generated in the first trophic level. This is why the distribution of productivity within a community
has been represented by a pyramid.
B. Boiogeochemical cycles: How is it that nutrients move?
Both biological and geologic processes move elements. Recycling is a key feature of biogeochemical cycles.
Many are carried by the movement of water (the hydrologic cycle).
Also note that some elements are not very soluble, they tend to move with solids (organic matter or soil for example)
- movement in air ( if a gaseous phase exists)
- uptake and incorporation into biomass (converts inorganic to
organic forms)
- other chemical reactions (precipitation, etc).
Key elemental cycles include carbon, nitrogen, phosphorus,
and sulfur. These will be discussed in class.
C. Ecological Modeling
Ecosystems are linked on a global scale:
Case Study on ecosystem interactions - see the deformed frogs web site.
Riparian zones - ecosystem buffering
Valuation of Global Ecosystems